
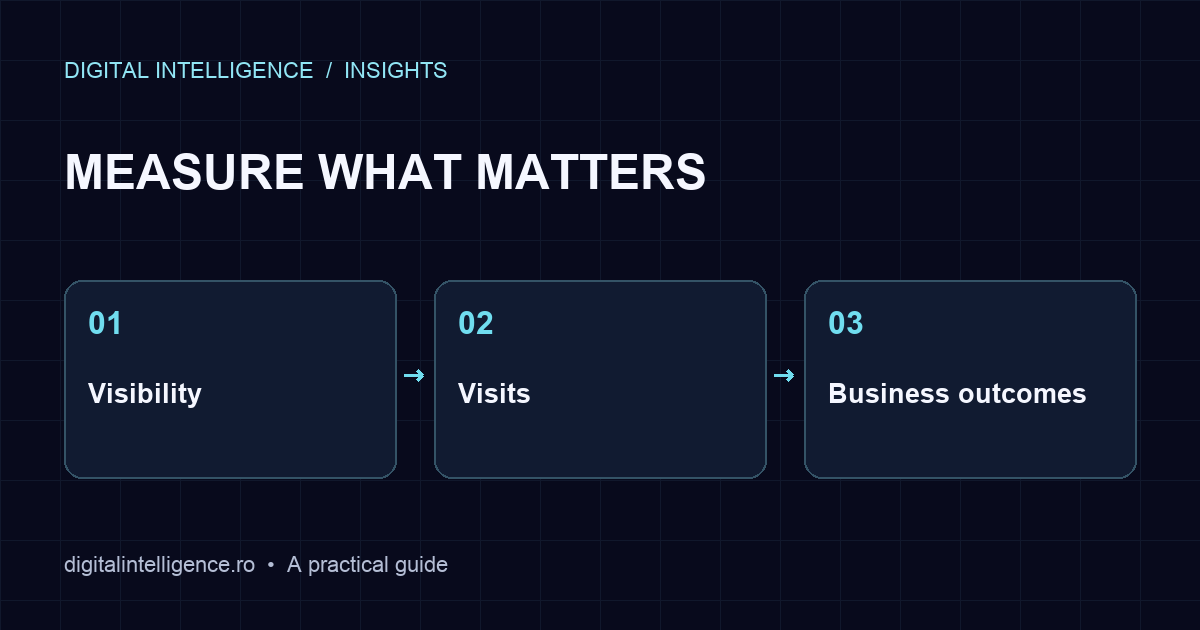
Keep visibility, visits and business outcomes in separate reporting layers. Join them where the evidence allows; leave gaps visible rather than attributing every new sale to AI.
Use the new reports for the questions they answer
Google’s generative AI performance report records impressions from AI Overviews and AI Mode, with breakdowns such as page, country and device. Google says the insights rolled out worldwide by 31 August 2026, although a site without enough impressions may not see the report. Its property and page totals use different aggregation, so do not add page rows and expect them to match the headline total.
Bing’s AI Performance report covers citations across supported Microsoft and partner AI experiences. It includes cited pages and sampled grounding queries—the phrases used to retrieve information. Citation counts do not show ranking, placement or sales.
These reports provide useful platform evidence. They do not cover every AI service, every mention without a link or every customer journey. Keep each platform’s metric name and scope in your report.
Build a report with three separate layers
Scroll the table sideways to see every column.
| Layer | Record | What it helps you decide |
|---|---|---|
| Visibility | Platform, date range, metric, cited or displayed URL, country where available | Which pages appear, and where is information missing? |
| Visits | Identifiable referral source, landing page, engaged actions and tracking limits | Are identifiable visitors reaching useful pages? |
| Business outcome | Qualified enquiries, fulfilled orders or another agreed outcome | Does the traffic appear commercially relevant? |
Choose one reporting period and record each tool’s date boundaries and time zone. Keep a separate entry for unavailable data. “No report available” and “zero impressions reported” mean different things.
Do not combine Google impressions and Bing citations into a single reach figure. They are different observations, potentially involving overlapping audiences. A neat combined number would hide information rather than clarify it.
Create a baseline that survives the next website change
Start with a small set of pages tied to a business need: a service page, a product category and a guide answering a common buying question. Save the available platform reports and analytics for a complete period before the change.
- Name the page and the customer question it should answer.
- Record the current URL and language, report filters and measurement definitions.
- Log the change: what was edited, why and when it went live.
- Compare equivalent periods, noting campaigns, seasonality and tracking changes.
- Choose the next action based on the page’s purpose and the evidence.
If a page is new, say that it has no prior baseline. If a campaign or a promotion changed at the same time, avoid presenting the comparison as a controlled experiment.
Use manual AI checks as observations, not market share
Manual checks can show whether an answer describes your business accurately. Define a few real buying questions in the relevant language. Record the exact question, platform, date, answer context, brand mention and source link. Save the result so someone else can understand the observation.
Repeat under comparable conditions when practical, but expect answers to vary. A small prompt sample is not a representative survey of all buyers. Avoid reporting “AI market share” from a handful of selected questions.
Use an inaccurate answer to investigate your own pages and public business information. Correct an unclear service description or outdated term where you control it. A missing citation alone is not evidence that adding a particular phrase will solve the problem.
Connect visits to outcomes without inventing attribution
Where analytics identifies an AI referral, follow its landing page and recorded actions. For enquiries, agree what counts as qualified: for example, the service requested and the market served fit your business. For a shop, distinguish orders placed from cancellations and returns when judging commercial value.
Referrer information can be missing, and people can return through another channel. A voluntary “How did you hear about us?” answer can add context, but memory is imperfect too. Treat these signals as partial evidence rather than forcing an attribution percentage.
Make the report end with a decision
If a useful page appears but its offer is unclear, improve the explanation and next step. If the information is wrong, fix the facts first. If data is too sparse, keep the measurement modest and focus on customer questions you can answer well.
Google’s AI-search guidance continues to emphasise established SEO and useful, original content. There is no special schema or llms.txt shortcut that guarantees inclusion. Structured data should match the page; an llms.txt file can serve as a readable directory without becoming proof of ranking benefit.
When commissioning SEO and AI-search visibility work, agree which platforms, pages and languages are covered, the reporting frequency and who acts on the findings. Digital Intelligence can discuss this within a defined project; ongoing monitoring should be explicit in the scope.
Sources for factual claims
- Google Search Console: generative AI performance report
- Bing Webmaster Tools: AI Performance
- Google Search Central: optimizing for generative AI features
Sources checked 9 October 2026. Plans, checklists and examples are editorial analysis, not client performance results.